
 “Stats”
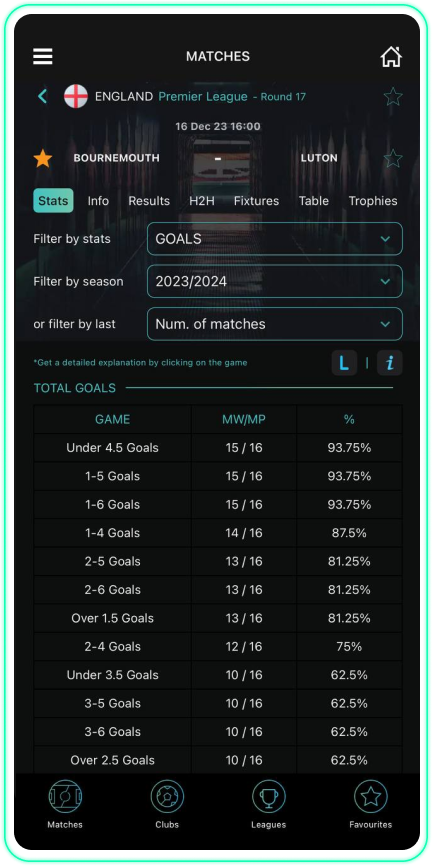
In the "Stats" tab, we have 3 filters:
1) Filter by STATISTICS (you can choose one of the 17 offered categories).
2) Filter by SEASON (you can choose one of the 4 offered seasons).
3) Filter by LAST (you can choose 10/20/30/40/50 or 60 last matches).
 First, select the filter by STATISTICS (in the image, the category GOALS is selected).
 Then, choose either the filter by SEASON or the filter by LAST (in the image, the filter for the current season 2023/2024 is selected).
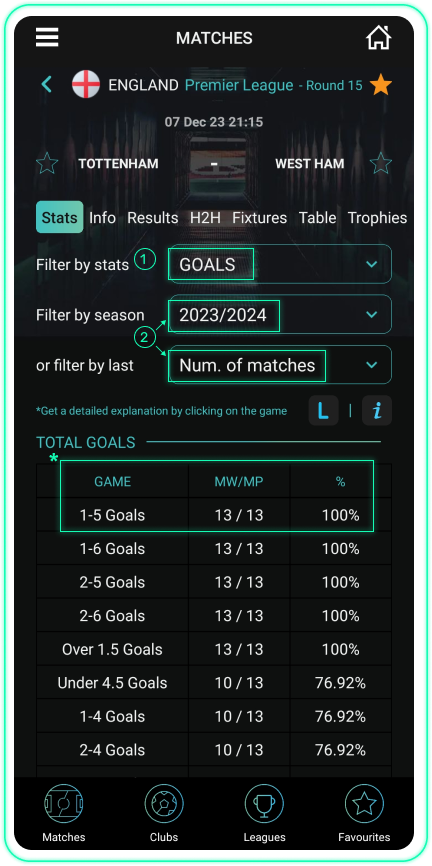
 If you choose the filter by SEASON, you will receive statistical data for the selected season. If you choose the filter by LAST, you will receive statistical data for the selected number of recent matches.
 13/13 means that the game of 1-5 goals in a match occurred in 13 out of a total of 13 played matches.
 “Info”
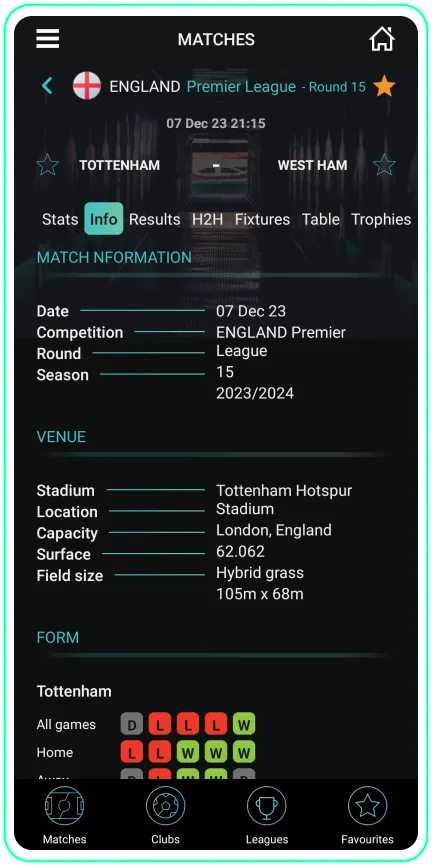
In the info section, there are details about the match, the venue of the match, the form of the teams in their last 5 matches on all grounds (home and away) and a tabular view of the teams that are meeting.
 “Results”
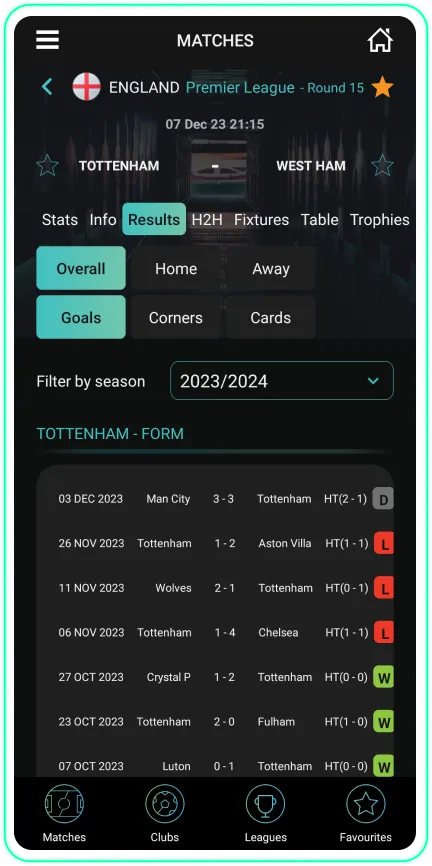
In the first row, there are 3 tabs: OVERALL, HOME and AWAY (you can select one of these three offered tabs).


In the second row, there are 3 tabs: GOALS, CORNERS and CARDS (you can choose one of these three offered tabs).


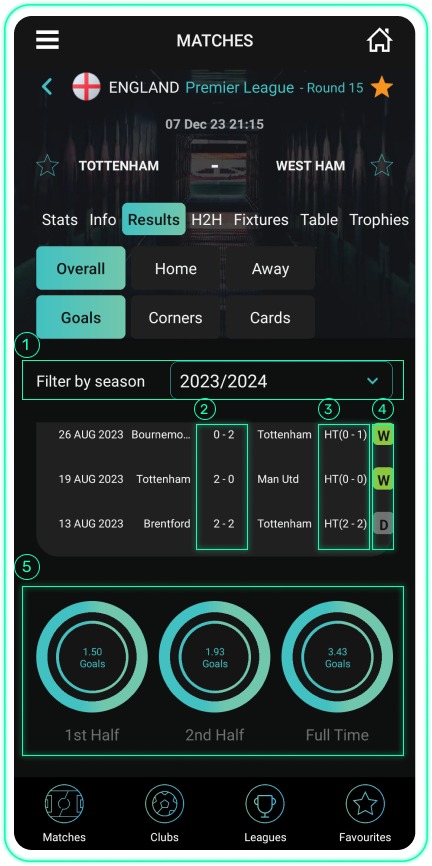
In the season filter, we choose for which season we want the results to be displayed (in the image, the current season 2023/2024 is selected).
The rectangle with the number 2 shows the results of matches for the selected season.
 The rectangle with the number 3 shows the results in the first half for the selected season.
 The rectangle with the number 4 has three markings: W for win, D for draw, and L for lost match.
 The circles below the results show the average of GOALS, CORNERS or CARDS for the selected tabs and chosen season.
“Results” “Goals”
The 3 circles below the team's results in the selected season show the average of GOALS.
The first circle represents the average of GOALS in the first half.
The second circle represents the average of GOALS in the second half.
The third circle represents the average of GOALS for the entire match.
In the image you see, the ALL tab from the first row, the GOALS tab from the second row, and the 2023/2024 season from the filter have been selected.
So, we get the results of the home team as well as the away team for the season 2023/2024.
The 3 circles below the team's results show that the form in the season 2023/2024 is as follows:
1.50 goals in the first half (sum of goals scored and conceded in the first half)
1.93 in the second half (sum of goals scored and conceded in the second half)
and a total of 3.43 goals scored in the entire match (sum of goals scored and conceded in the whole match)
“Results” “Corners”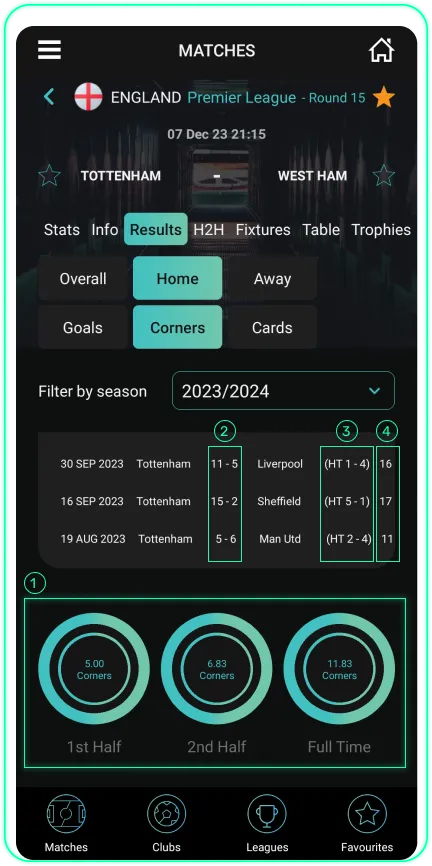
The 3 circles below the team's results in corners for the selected season show the average of CORNERS.
The first circle represents the average of CORNERS in the first half for the selected season.
The second circle represents the average of CORNERS in the second half for the selected season.
The third circle represents the average of CORNERS for the entire match in the selected season.
The rectangle with the number 2 shows the results in corners during the match.
The rectangle with the number 3 shows the results in corners during the first half.
The rectangle with the number 4 shows the total number of corners in the matches.
In the image you see, the ALL tab from the first row, the CORNERS tab from the second row, and the 2023/2024 season from the filter have been selected.
So, we get the results in corners for the home team as well as the away team in the season 2023/2024.
The 3 circles below the team's results in corners show that the form of the team in the season 2023/2024 is as follows:
5.00 corners in the first half (sum of corners taken by the home team and corners taken by the away team in the first half)
6.83 in the second half (sum of corners taken by the home team and corners taken by the away team in the second half)
and a total of 11.83 corners in the entire match (sum of corners taken by the home team and corners taken by the away team in the whole match)
“Results” “Cards”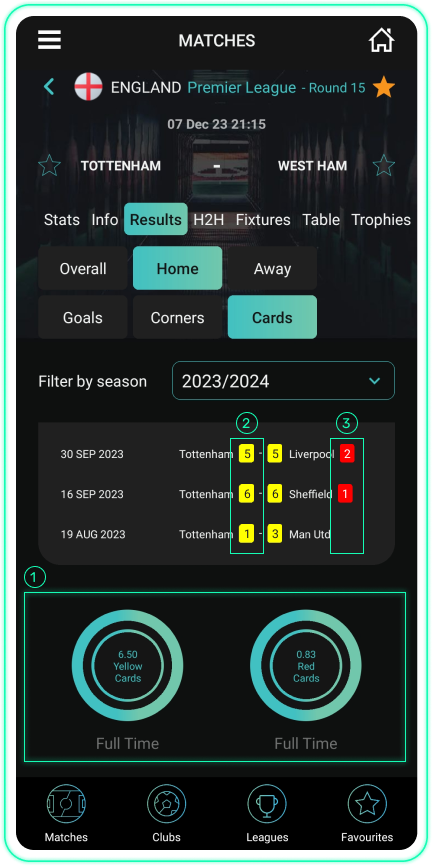
The 2 circles below the team's results in cards for the selected season show the average of CARDS.
The first circle represents the average of YELLOW CARDS per match for the selected season.
The second circle represents the average of RED CARDS per match for the selected season.
The rectangle with the number 2 shows yellow cards in the matches.
The rectangle with the number 3 shows red cards in the matches.
In the image you see, the HOME tab from the first row, the CARDS tab from the second row, and the 2023/2024 season from the filter have been selected.
So, we get the yellow cards for the home team as well as the away team in the season 2023/2024.
The 2 circles below the team's results in cards show that the form of the team in the season 2023/2024 is as follows:
6.50 yellow cards per match (sum of yellow cards received by the home team and yellow cards received by the away team in the match)
0.83 red cards per match (sum of red cards received by the home team and red cards received by the away team in the match)
“H2H”Head-to-head represents the mutual relationship between the teams that are facing each other (in the image, the match between Tottenham and West Ham is shown).
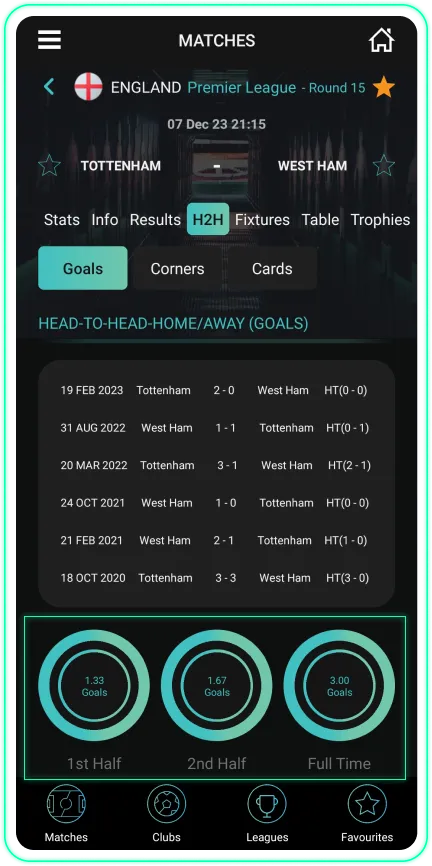
Since 2020, they have faced each other 6 times.
The first circle represents the average goals scored in the first half for all 6 matches in the image.
The second circle represents the average goals scored in the second half for all 6 matches in the image.
The third circle represents the average goals scored in the entire match for all 6 matches in the image.
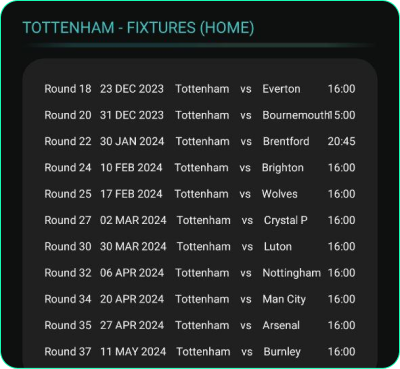
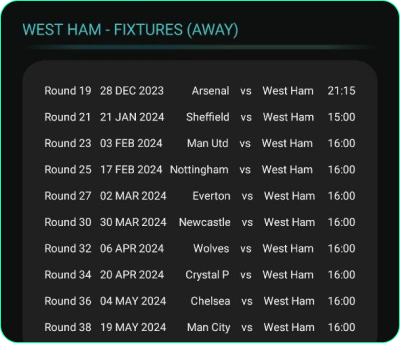
“Fixtures”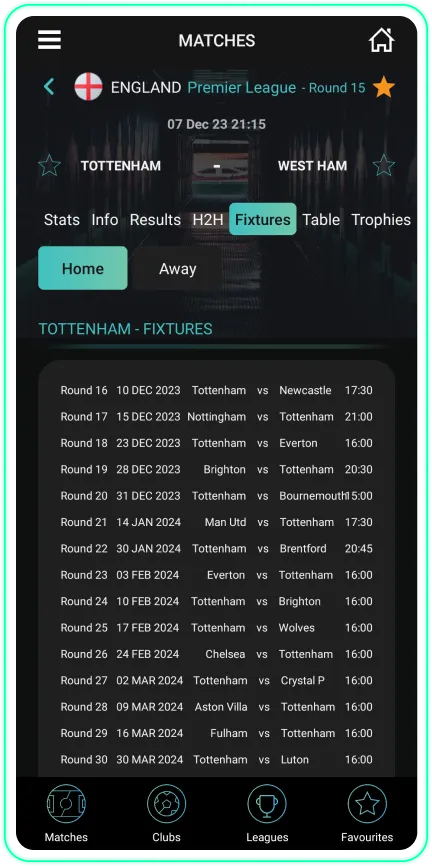
You have two options:
Future matches for the HOME team. Future matches for the AWAY team.In the image, we have selected the HOME tab, so the first table displays all the future matches of Tottenham.
 “Tables”
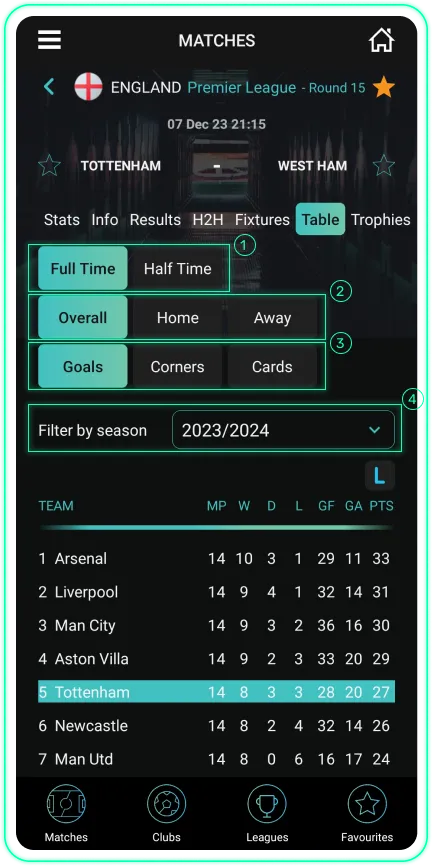
In the first row, we have 2 tabs: FULL TIME and HALF TIME.
In the second row, there are 3 tabs: OVERALL, HOME and AWAY.
In the third row, there are 3 tabs: GOALS, CORNERS and CARDS.
* From each row, you can select only one tab, and based on that, you get a tabular view for the selected tabs.
Season filter - here, we choose the tabular view for a specific season, in our case, the 2023/2024 season.
* Currently, the tables show the positions of teams at the beginning of the given round and are not updated after all matches in that round are played. If it's current, let's take an example of the 14th round where the tables display the positions of teams at the end of the 13th round and are updated only after the 14th round is completed, so they will be updated at the beginning of the 15th round.
“Trophies”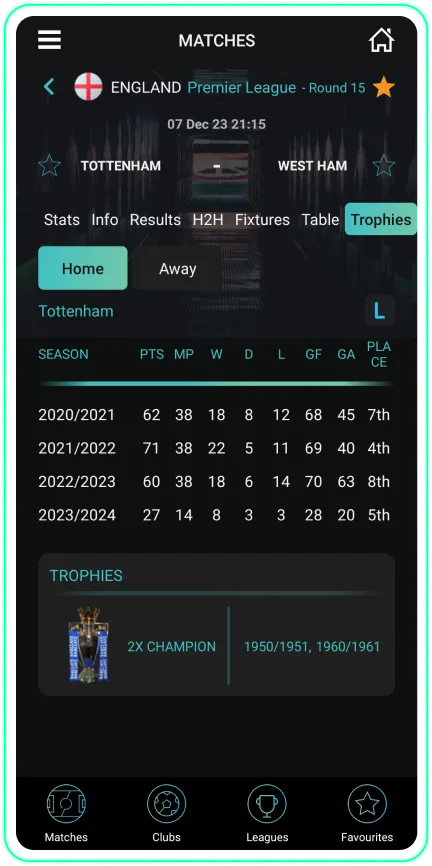
You have two options:
 Home - by clicking on this tab, you get a tabular view of the home team's performance in the last 4 seasons, including when and how many trophies they won for a specific league.
 Away - by clicking on this tab, you get a tabular view of the away team's performance in the last 4 seasons, including when and how many trophies they won for a specific league.
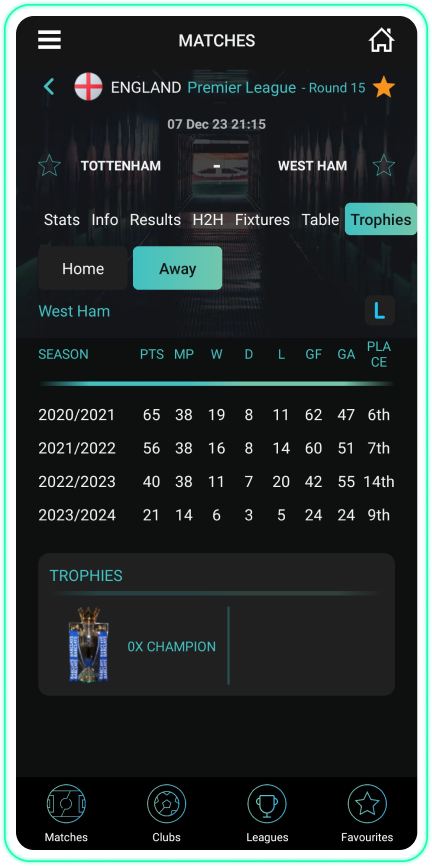
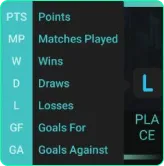
PTS - Points; MP - Played matches; W - Wins; D - Draws; L - Lost matches; GF - Goals scored; GA - Goals conceded;
“Stats”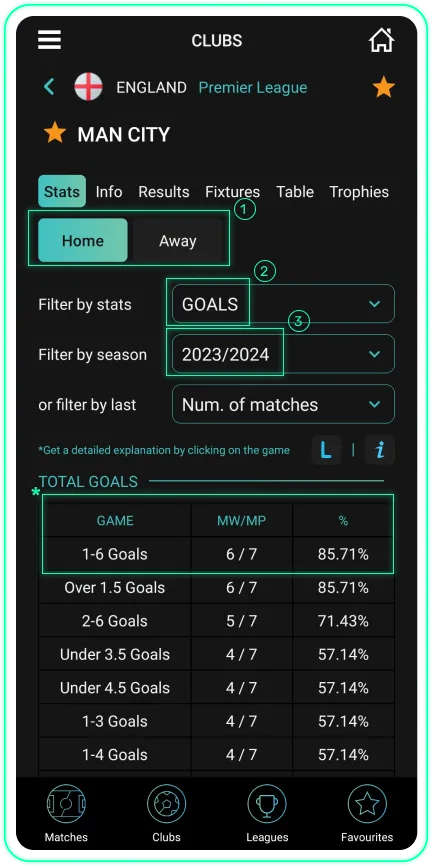
You have two options:
Home - by clicking on HOME, you get statistical data on how the team performs on their home ground. Away - by clicking on AWAY, you get statistical data on how the team performs on their away matches.We choose whether we want to get statistical data for when the team plays at home or away (in the image, HOME is selected, which means that the table provides statistical data on how Man City performs at home).

In the STATISTICS FILTER, we choose one of the offered 17 categories (in the image, the category GOALS is selected).
Then, we select FILTER BY SEASON or FILTER BY LAST MATCHES (in the image, the filter by last 15 matches is shown).

* In the last 7 matches at their home ground, Man City played 1 to 6 goals per match in 6 out of 7 played matches, which gives a historical passing probability of 85.71%.
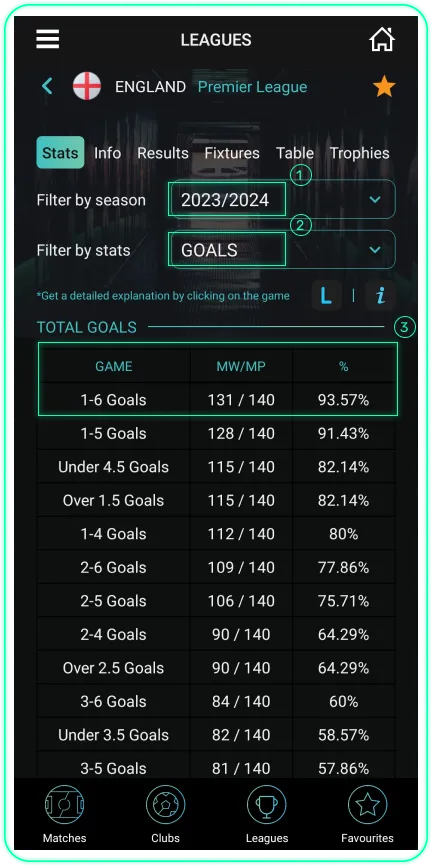
You select one of the 4 offered seasons from the filter (in the image, the 2023/2024 season is chosen).
In the statistics filter, you choose one of the 17 offered categories (in the image, the category GOALS is selected).
The rectangle marked with number 3 indicates that in the 2023/2024 Premier League season, game 1-6 goals came 131 out of a total of 140 matches played, giving a passing probability of this event in the 2023/2024 season as high as 93.57%.
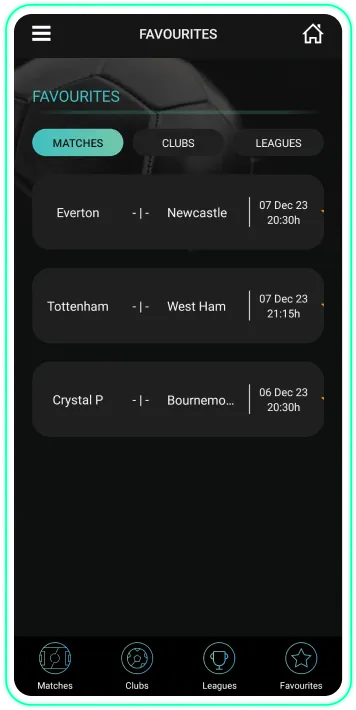
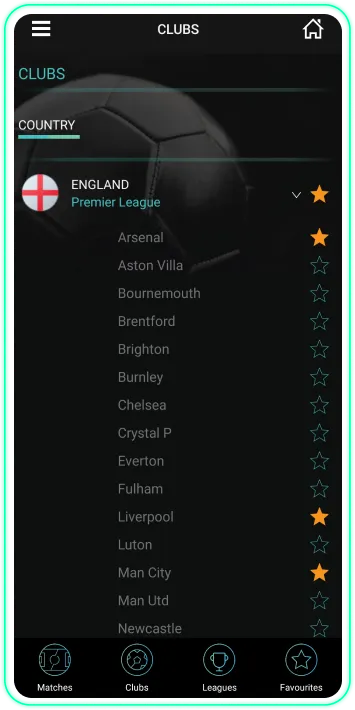
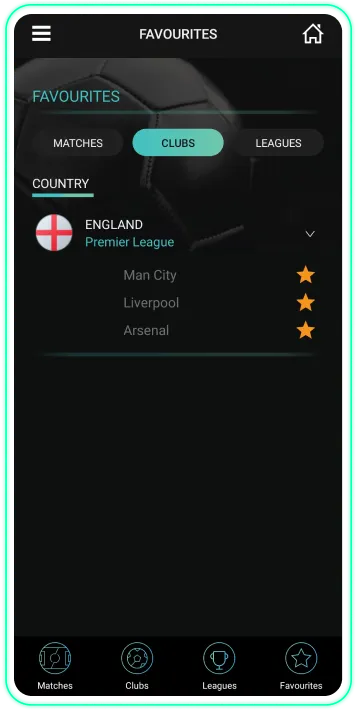
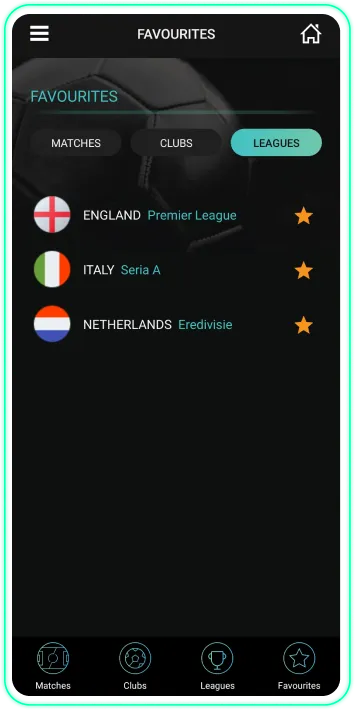
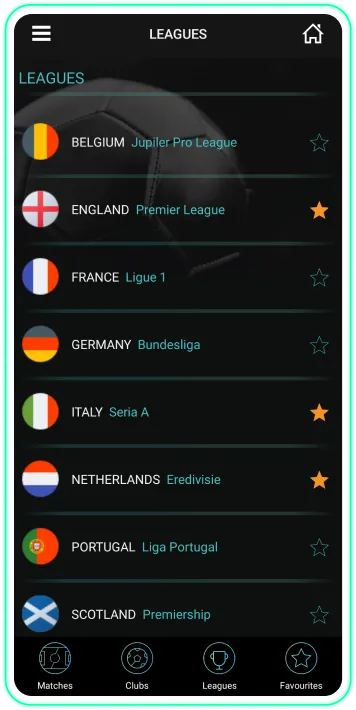
By clicking on the star, that match, club, or league is added to favorites so that you can easily access your favorite matches, clubs or leagues.
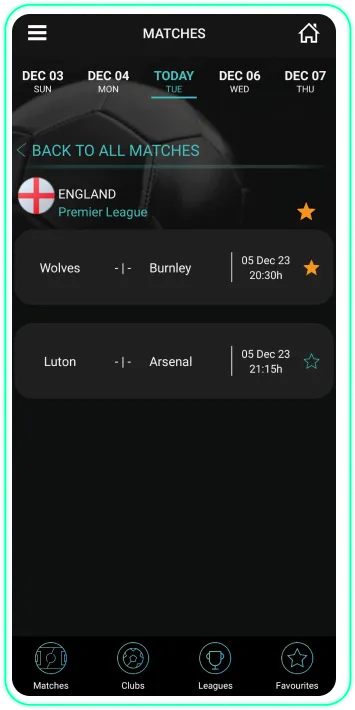
We have selected the 2023/2024 season.
Bournemouth played in the Premier League during the 2022/2023 season.
Luton did not play in the Premier League during the 2022/2023 season, they played in the Championship.
By clicking on "Profile," you can access your profile and other app details from the menu.
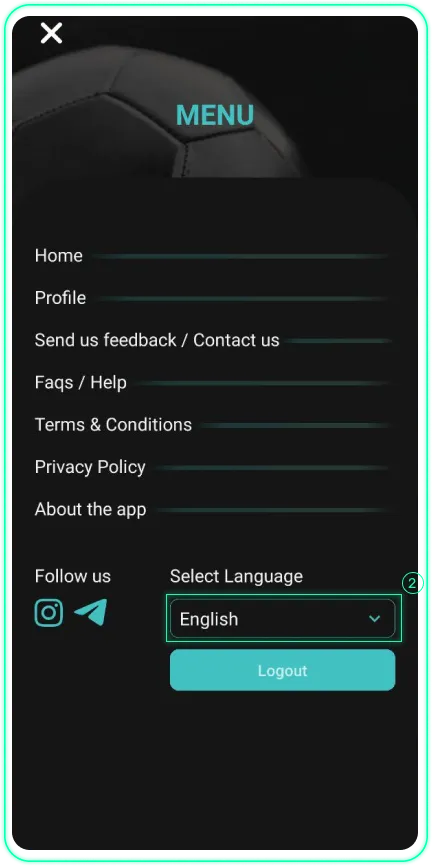
You can change the language by clicking here.